 QASWA
The problem
The front end of a market study is the same 18 tables, charts and maps every time — unemployment, employment, wages, permits, crime, commuting, amenities — each pulled by hand from a different government source, retyped into Word, and then re-checked the moment an agency publishes a new month. None of it is analysis.
What we built
A multi-tenant SaaS platform we designed, secured, and operate ourselves. Type a property address; 12 official sources auto-fill while you watch; you review each tab, choose the economic-conditions conclusion, and export a Word document where every table is an image and every figure carries its source, vintage and retrieval date.
A real report, not a mockup
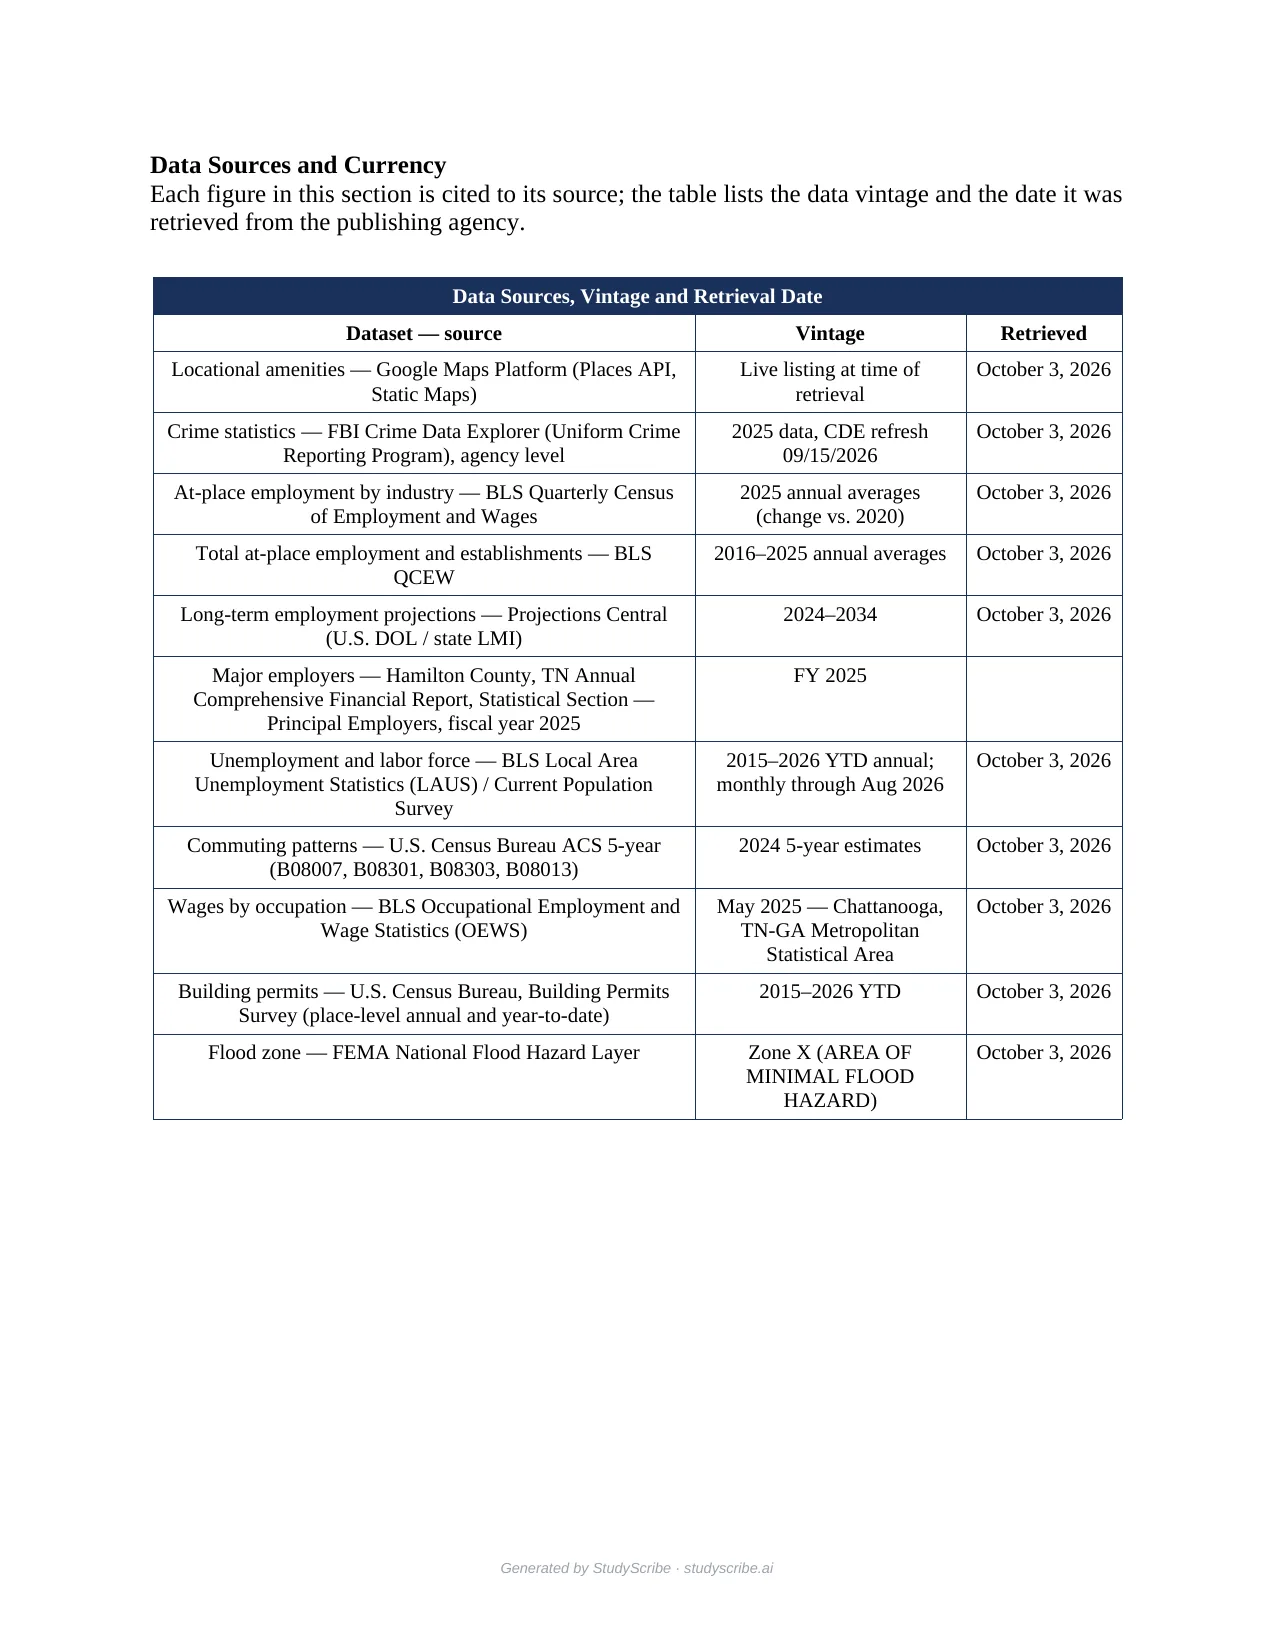
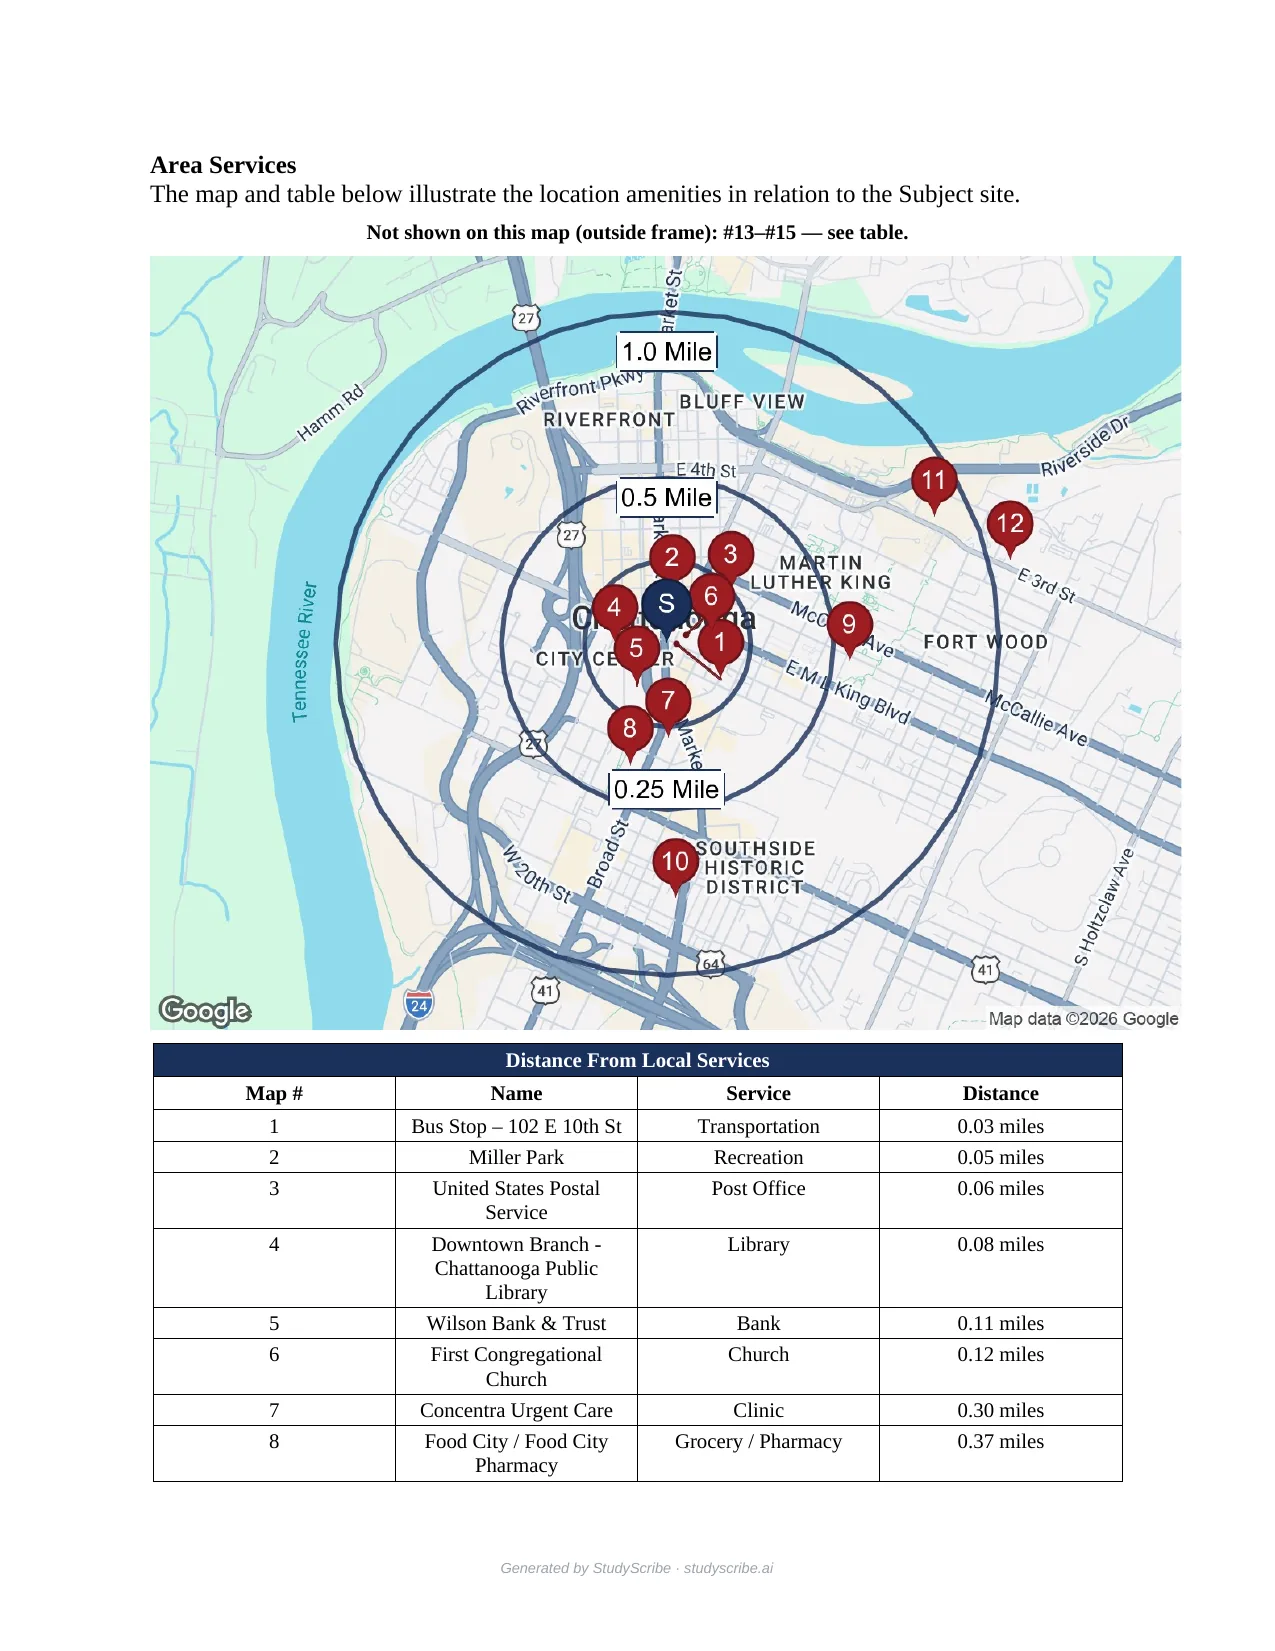
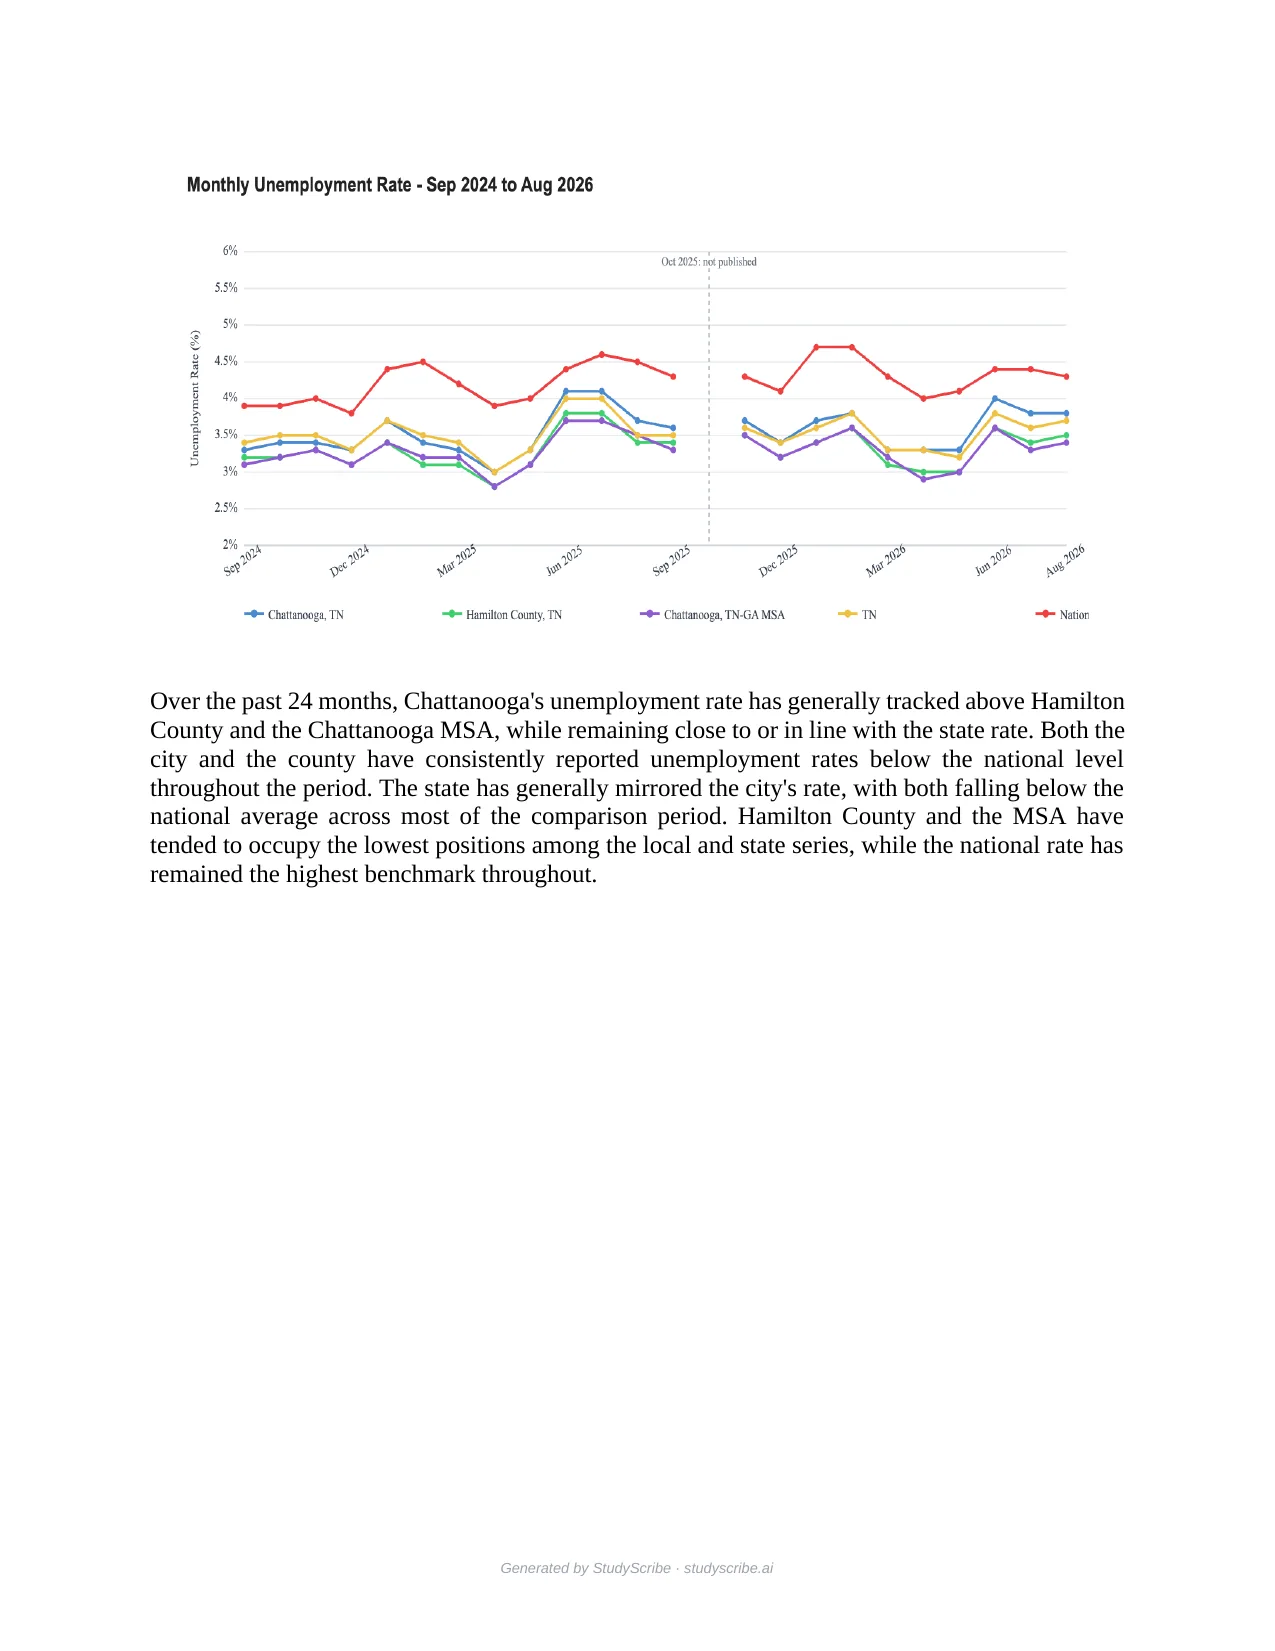
Pages from the sample StudyScribe generated on October 3, 2026 for a downtown Chattanooga address. Download the full sample (.docx) · View the PDF (18 pages)
How it works
- 12 official sources — BLS, Census Bureau, FBI crime data, Projections Central, NCES, FEMA and transit agencies' GTFS schedules — plus Google Maps Platform for nearby amenities and distances
- Figures are never generated: if a source hasn't published one, the cell stays blank
- A QC pass flags missing figures, stale sections and unsupported language before you can export
- Rerun one section on its own when an agency publishes a new month
- LIHTC, HOME, HTF, RAD, HUD 202/221(d)(4)/223(f)/811/232 and USDA 515/538/514 projects
Built and run by us
Multi-tenant from day one: SSO, role-based access, per-firm branding and billing. It's where our engineering standards get proven first — on our own uptime and our own users. Accounts are invite-only, and each starts with one free report.